New Interactive Map Strengthens Climate Resilience and Wildlife Connectivity
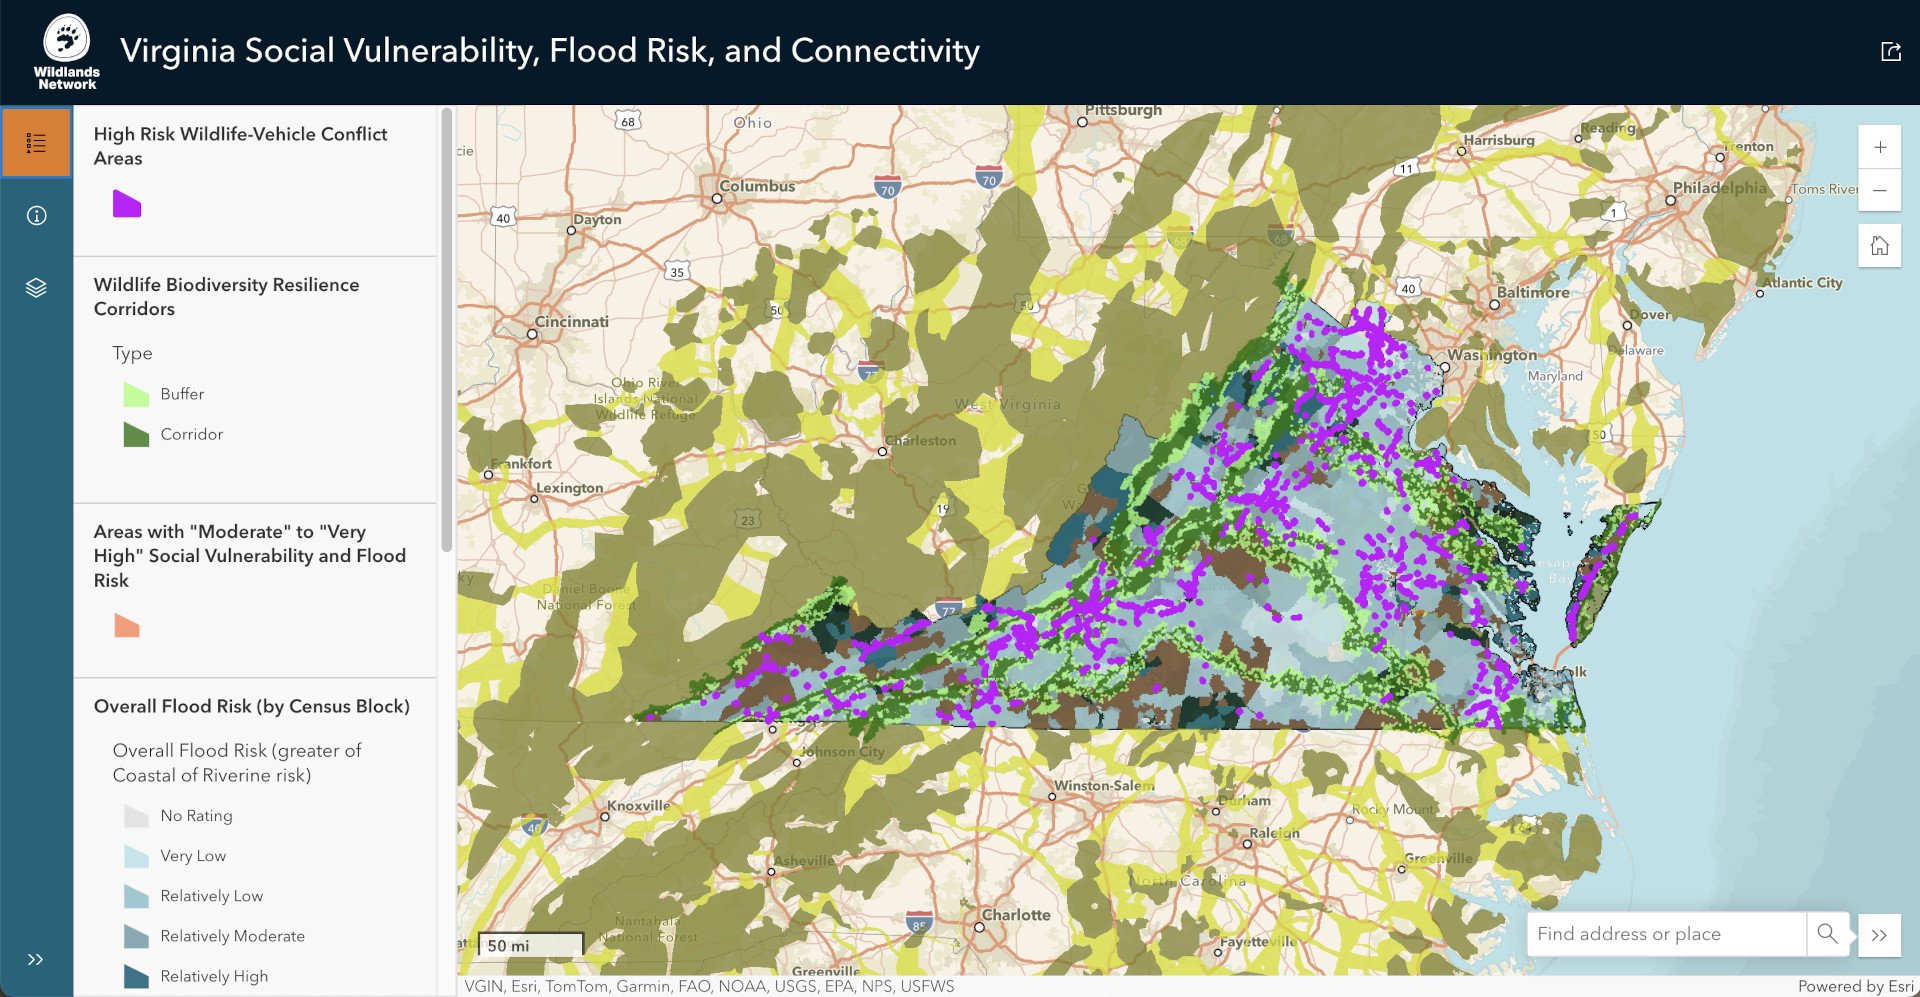
A culmination of high social vulnerability, flood risks, and wildlife-vehicle collisions as well as key habitats and corridors from our Eastern Wildway and Virginia’s Wildlife Biodiversity Resilience Corridors that demonstrate the most important sites for infrastructure updates.
For the past few years, Wildlands Network staff have been eager to learn more about how we can simultaneously improve habitat connectivity while also promoting more climate-resilient infrastructure and communities. We were excited to learn how upsizing culverts or replacing culverts with bridges could both facilitate terrestrial wildlife passage and allow for increased flood waters to pass without damage to the road above.
Today, as we grieve with the communities impacted by the extreme scale of flooding and damage caused by Hurricane Helene and Milton, we acknowledge that this type of improved infrastructure may not have prepared communities for the drastic level of these particular storms’ impact. That said, as we continue to support our staff working on the ground in this recently impacted landscape, we are also continuing to think deeply about how best to build climate-resilient infrastructure across North America to better prepare for the expected increase in stormwater flooding in the decades to come.
We encourage our supporters to explore opportunities like this to help communities impacted by Hurricane Helene and Milton, and to read on to learn more about how we can best align existing resources to build multi-purpose, climate-resilient infrastructure.
Earlier this year, we started looking at potential multi-use infrastructure options on a smaller scale by creating an interactive map that layers social vulnerabilities, flood risks, and wildlife-vehicle collisions in Virginia. The areas with overlapping risks show where we can upgrade infrastructure like culverts to simultaneously support wildlife connectivity, reduce wildlife-vehicle conflicts, and better accommodate climate-related risks like flooding. As a result, these updates would allow people and wildlife to better respond to changes in weather patterns, improving resiliency to climate impacts and bolstering biodiversity by improving habitat connectivity.
Misty Boos, our U.S. Conservation Policy Manager, breaks down this map in detail to explain exactly how to use it to improve infrastructure and conservation plans across an array of critical issues. Hear from Misty and explore the map below.
Explore the interactive map above. You can also open a new tab and view the map in ArcGIS here.
Can you break down this map for us – how are social vulnerability and flood risk related in Virginia?
Misty: Many areas in Virginia, both coastal and inland, are vulnerable to flooding. The map uses darker shades of blue to indicate the areas at highest risk for flooding.
Flood risk ratings in Virginia.
The CDC's Social Vulnerability Index (SVI), shown below, helps identify communities that are more vulnerable to crises like flooding by measuring factors such as poverty, overcrowded housing, limited transportation access, and exposure to natural or human-caused disasters.
Social vulnerability ratings in Virginia.
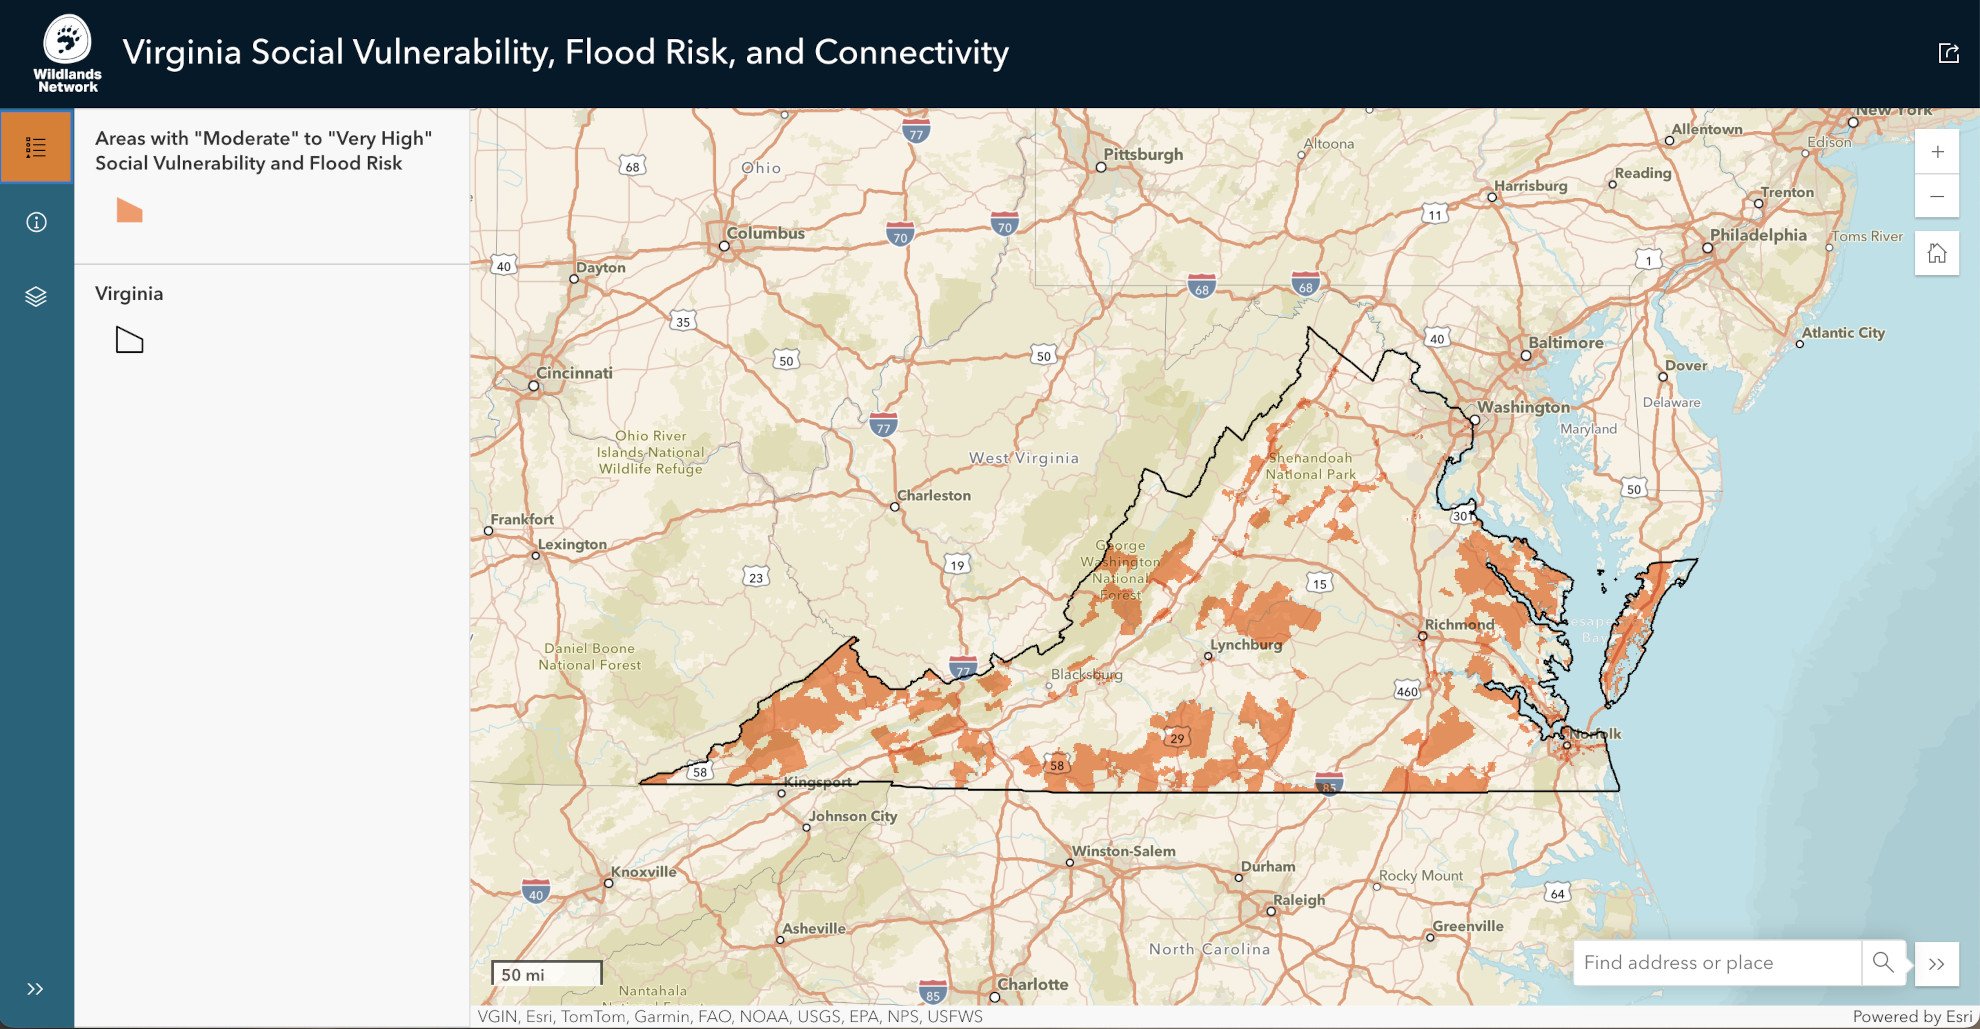
By combining census blocks with a flood risk index of "Moderate," "High," or "Very High" and a social vulnerability index of "Moderate," "High," or "Very High," we can identify significant areas of overlap, highlighted in orange on the map. These areas represent communities with limited resources that are at the greatest risk of being affected by flooding events.
Sites in Virginia where the highest risk of flood and social vulnerability overlap.
What are wildlife biodiversity resilience corridors and Eastern Wildway Connectivity Corridors? Why are they important?
Misty: In dark and bright green, you will see Wildlife Biodiversity Resilience Corridors developed by the Virginia Department of Conservation and Recreation for the State’s Wildlife Corridor Action Plan. These are key regions they have identified for the protection of wildlife movement and ecological health. Notably, the state primarily focused on riparian corridors and habitat in the Appalachian Mountain corridor.
A network of lands called Wildlife Biodiversity Resilience Corridors which Virginia has recognized as important for ecological integrity, biodiversity conservation, recreation, and other ecosystem services, allowing wildlife to move through the landscape.
In dark and light green, the map shows the Eastern Wildway Habitat Core Areas and Connectivity Corridors. These areas are part of our organization’s conservation vision to protect and restore ecological connectivity across the eastern U.S. Habitat Core Areas provide critical spaces for wildlife, while Connectivity Corridors link these habitats, allowing species to move, migrate, and adapt to environmental changes. Together, these cores and corridors form a network that supports wildlife movement, biodiversity, and ecosystem resilience.
Our Eastern Wildway’s core habitats and connectivity corridors throughout the region.
Once combined, viewers will note that there is significant, if not complete, overlap between the state’s Wildlife Biodiversity Resilience Corridors and Wildlands Network’s Eastern Wildway cores and corridors. These overlapping areas target the specific locations where infrastructure improvements and conservation actions would enhance ecosystem resilience.
Areas where our Eastern Wildway habitat cores and corridors overlap with Virginia’s Wildlife Biodiversity Resilience Corridors.
How do they connect to flood risks and wildlife-vehicle conflicts in Virginia?
Misty: In addition to the need to bolster biodiversity in Virginia, the Commonwealth’s infrastructure is not equipped to handle the increased flooding projected due to climate change. More than 50% of the state's culverts block aquatic species movement and are inadequate for rising flood risks, endangering both wildlife and local communities. Additionally, Virginia ranks 9th nationwide for wildlife-vehicle collisions. The state’s Wildlife Corridor Action Plan has pinpointed areas with high wildlife-vehicle conflict risks. On the map, road segments with exceptionally high rates of these collisions are shown in purple.
Road segments in Virginia with exceptionally high rates of wildlife-vehicle collisions.
Upgrading infrastructure like culverts in these areas and providing wildlife passage at the same time presents an opportunity to improve flood resilience while reducing wildlife-vehicle collisions. Culverts should be designed to accommodate both terrestrial and aquatic species, wide enough to maintain natural stream banks for land animals, and deep enough to sustain channels for aquatic life. These features would ensure safe wildlife passage and protect communities from future flooding.
Who can use this map, and how will it be used?
Misty: This map can be used by policymakers, transportation planners, conservationists, and local governments to prioritize infrastructure improvements and conservation plans. By identifying areas with overlapping risks, like high social vulnerability, flood risk, and wildlife-vehicle conflicts, decision-makers can allocate resources to effectively support a broad array of critical issues facing Virginia. Importantly, tackling multiple issues with one project opens eligibility for more federal grant funding opportunities. The map supports Virginia’s Wildlife Corridor Action Plan and could guide future funding applications, conservation efforts, and infrastructure upgrades to protect both wildlife and overburdened communities.
Can this map help prevent flooding and strengthen resilience to climate change? How?
Misty: Yes! The map highlights flood-prone areas and can inform the location of potential infrastructure that could accommodate both wildlife movement and increased flood risk. By identifying areas that need flood-resilient underpasses and culverts, it helps planners build crossing infrastructure that is resilient to climate impacts. Incorporating these upgrades into road design will reduce flooding damage, improve wildlife connectivity, and strengthen the overall resilience of ecosystems and communities in Virginia.
This map was developed through a collaborative effort by Wildlands Network and Wild Virginia for the Virginia Conservation Network 2025 briefing book. For more information, you can visit the briefing book here.


